In my previous post, I shared the challenges of finding a suitable replacement for my aging mechanical wind speed sensor. This post will share my experiences with the new ultrasonic sensor, including my observations, technical details, and insights that might be helpful if you encounter a similar situation.
Comprehensive Weather Data with the WQX7
WQX7 Ultrasonic weather station measures ambient temperature, ambient humidity, wind speed, wind direction, barometric pressure, rainfall and illumination/global radiation. I could probably go with the basic model measuring just wind speed and direction, because I already have outdoor temperature and humidity sensors since the very beginning. But I was kind of interested in atmospheric pressure as well, and together with solar radiation and rain sensor it sounded like ideal combination for me.
Housing and mount options

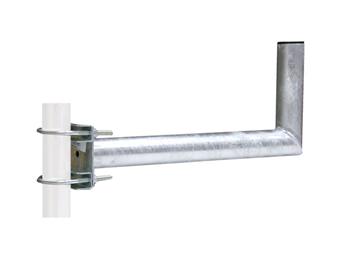
The unit is made from some plastic material (ASA Engineering Plastic). It is designed to be mounted on the supplied bracket (flange), or simply on any pole with a diameter of ~48 mm used for antennas and other accessories.
The cable connection is done from the bottom of the unit. There is a round four pin connector located on the cable inside the hole where the holding pole or mount goes in, so you can route the cable that way in the space between the pole and the unit. Or even better, if you can have the cable routed inside the holding pipe, then it becomes invisible and covered as well, which is what I did.

The only thing you need to pay attention is to align the small arrow towards the north orientation in order to get the wind direction reported properly. You can also notice the four ultrasonic transducers, small devices that emit and receive the ultrasonic sound waves and by measuring the time it takes for the ultrasonic pulses to travel between the transducers, the anemometer can determine the wind speed and direction.
From the manual I can read that the working environment temperature should be between –30˚C and +70˚C, humidity in the range of 0-100% (no condensation). The expected lifetime is more than 3 years, except for SO2\NO2\CO\O3\PM2.5\PM10 sensors, which do 1 year without rugged surroundings. None of these sensors is included in Fengtu WQX7 weather station, it is the domain of higher models.
Wiring
Wiring the weather station is relatively simple. You get the 3m cable with it which can be connected to the device. I asked for some customizations. First one was the input voltage, where I asked for 24V DC version (12 V DC is standard), and then 5-meter-long cable (3m is the standard).

I anticipated a more elegant solution for my request for extra cable length than simply extending the original cord, which I could have easily done myself. However, I understand. According to the datasheet the power consumption should be less than 1W and there is no heating for de-icing the wind chambre.
To minimize the risk of lightning damage to the home automation system, I strongly recommend including surge protection/arresters in the installation. This should encompass both the DC power circuit and the data pair, particularly if the installation is in a location prone to lightning strikes. I have placed this weather sensor to the very top of the roof, so I placed surge protection box between the roof circuits and the main cabinet. That consists of SALTEK DP-024 for the DC24V and DM-006/1R DJ for the Modbus line. (The box contains also a few other things, but these are for other devices located on the roof as well).

Originally I planed to use Modbus over AIR, but I encountered a Loxone limitation that made me change my plans. More details are in the chapter “Communication with Loxone” below.
Together with the device I got USB to RS485 converter, but I did not use that one at all. I have integrated the weather station using Loxone Modbus extension, more details are in the dedicated section.
Sensors in the WQX7 Ultrasonic weather station
It is obvious that the manufacturer based the whole product range on some kind of modular basis. This model series starts with two sensors (model FT-WQX2) and goes up to ten (model FT-WQX10). While I haven’t disassembled my device, it appears that the sensors within the unit operate independently. Instead of a central control unit, multiple sensors seem to be directly connected to the Modbus line. This modular approach offers advantages, such as flexibility for future expansions. However, it also means that each sensor has its own unique communication parameters. Consequently, acquiring a complete set of data requires communication with multiple devices. In the case of my WQX7, these four modules are:
- Wind speed and direction | 0xC8 (200)
- Temperature, Humidity, Pressure and Dew point | 0x66 (102)
- Illumination, Radiation | 0xCC (204)
- Optical rainfall | 0xCA (202)

Each one has a different communication address and can have different settings (baud rate). This does not represent a big issue, but if you for example want to change the default baud rate from 9600 to 115200, you’ll need to perform this change for each of the four modules separately. The default communication values for MODBUS-RTU here are: 9600,N,8,1 and minimum polling interval is 0.5 seconds.

Communication with Loxone
Because this weather station consists of the four modules described above, I couldn’t integrate it using Loxone Modbus AIR extension. For some reason, Loxone Modbus AIR can talk to only one Modbus device. Such a device is predefined with the Modbus address, and you can have only one at a time. Unfortunately, I learned about that limitation only after I purchased the AIR extension, and I couldn’t believe it until I was confronted with the datasheet. Very unpleasant “aha moment” for me, which resulted in a complete redesign of my weather station integration plans with Loxone. I had to purchase yet another Modbus Extension (non-AIR), same one as I use for my solar inverter. This extension doesn’t suffer from that severe limitation of communication with just one device. It can handle 32 devices and max. 253 sensors in total.
Now, obviously there was no definition template for this weather station in the Loxone Library. To make it work, I had to create it from scratch using the protocol that was provided.
In nutshell, under the Modbus Extension you’ll need to have four Modbus devices added, one for each module I mentioned above. You can name these the way you want, I have there Air, Wind, Rain and Sun. Underneath each one of these you’ll have the individual sensors. The reading of the values is done using command 3-Read Holding Register. For the Data Type please refer to the table in the Protocol section below. Make sure you have 16-bit register checkbox checked for all. Now the only one hassle is that Illumination and Rainfall uses 32-bit unsigned integer, which here means to read two 16-bit registers, and I was not sure about the correct order LowWord/HighWord. After experimenting a bit here, it seems for both the order is Low word first (so the Word Order check box unchecked), and same for Byte Order (Big Endian).

You can download the four XML template files. Renaming the .ZIP to .LxAddon might help, but I haven’t tested if the import can be done for all four sensors at once.
Displaying the actual values is very easy, similar to any other data you want to visualize. In case you want to display the wind direction in a textual form (instead of just an angle value), you need to use status block and manually define the expressions.

Unfortunately, this cannot be exported, I think.
Protocol
The protocol document I got is a combined overview for all devices in this product line, so it took a bit of time to find which parts are relevant. But I managed to access all the data I needed in the end.
A couple of months after installation I noticed strange behavior. From time-to-time data for Dew point and Ambient temperature started to go crazy. Initially I thought that it is some kind of random communication issue and set additional validation for the incoming data in Loxone to be in the range of –100 to +100 for temperature and dew point. So that helped to keep my charts safe, but I was losing data that were out of the validation range. When I debugged what the device was actually sending during these periods, I found out that the temperature I get are 65xxx values in temperature readings. And then I understood what was going on.
Unsigned 16-bit Integer cannot represent negative value. And this behavior started exactly at the beginning of winter season, when the temperatures reached the freezing point. Interestingly, the protocol documentation which I still have indicates for all data the format Uint16. For Unsigned 16-bit Integer the range is 0 to 65535. In that setting, as soon as the sensor reaches 0°C or below, the value as unsigned integer is wrongly interpreted as a huge number like 65xxx. One of the solutions is to use Signed Integer. Signed 16-bit Integer range is -32768 to 32767, representing both positive and negative values.
Switching to signed integer (I16) is crucial for correctly interpreting negative temperatures from your Modbus temperature sensor. The core problem lies in how the Modbus device encodes negative values within the 16-bit word. If the device uses two’s complement, simply changing the data type on the recipient side might not accurately interpret the encoded value.
If the device uses two’s complement, you’ll need to implement the two’s complement conversion logic on the recipient side, something like:
uint16_t unsigned_value = received_data;

int16_t signed_value;

if (unsigned_value > 32767) {

signed_value = unsigned_value - 65536; // Two's complement conversion

} else {

signed_value = unsigned_value;

}
What this does is:
1. Receive Data: Receive the 16-bit temperature value from the Modbus sensor as an unsigned integer (U16).
2. Interpret as Signed: If the unsigned value is less than or equal to 32767, the signed value is the same as the unsigned value. If the unsigned value is greater than 32767, subtract 65536 from the unsigned value to get the signed value.
Now, for the ambient temperature we do not anticipate the temperature to go above 327˚C, so the solution is to just change the data format on the Loxone side from Unsigned to Signed Integer and voila, this solved the issue.
And yes, I did report that issue together with my findings to the support. And got an updated manual. 😊 In the original manual that I have there are still some mistakes, but the table here should be correct. These are the values I am using:
| Name | Slave address | Modbus register | Register length | Data type | Variable units |
| Temperature | 0x66 (102) | 0x00 (00) | 1 | Signed 16-bit integer | /100 ˚C |
| Humidity | 0x66 (102) | 0x01 (01) | 1 | Unsigned 16-bit integer | /100 %RH |
| Pressure | 0x66 (102) | 0x02 (02) | 1 | Unsigned 16-bit integer | /100 kPa |
| Dewpoint | 0x66 (102) | 0x06 (06) | 1 | Unsigned 16-bit integer | /100 ˚C |
| Wind speed | 0xC8 (200) | 0x00 (00) | 1 | Unsigned 16-bit integer | /100 m/s |
| Wind direction | 0xC8 (200) | 0x01 (01) | 1 | Unsigned 16-bit integer | Degree |
| Rainfall | 0xCA (202) | 0x00 (00) | 2 | Unsigned 32-bit integer | /100 mm |
| Illuminance | 0xCC (204) | 0x03 (03) | 2 | Unsigned 32-bit integer | Lux |
| Radiation | 0xCC (204) | 0x05 (05) | 1 | Unsigned 16-bit integer | W/m2 |
Measurements
Wind
This ultrasonic wind sensor represents a significant upgrade for wind speed measurement. It now provides continuous readings for both wind speed and direction, capabilities that are currently lacking in the Loxone Tree/Air weather station. The absence of moving parts eliminates the need for maintenance like oiling, making it virtually silent. Based on the data, the ultrasonic sensor appears to capture higher wind gusts. Mechanical anemometers can be a bit slow to react, so they might not capture the full force of very sudden wind gusts. The ultrasonic sensor, on the other hand, can respond much faster.
The parameters that the manufacture provided are the following:
| Range | Resolution | Accuracy | |
| Wind speed | 0-60 m/s | 0.01 m/s | ±0.1 m/s |
| Wind direction | 0-360° | 1° | ±2° |
Rainfall
This is probably the most interesting thing here, the optical rainfall sensor. I must admit, I didn’t know how this works and when I started testing it, I couldn’t get any immediate results. It turned out that you must spray it really constantly in order to register an increase to the rainfall total, because even getting 1/100 mm of rain takes some time.

The important message here is that this optical sensor is a great replacement to the mechanical rainfall sensors, which measure the amount of rain for an hour and day. What this does not substitute is the immediate rainfall detection you might need for closing roof windows or retracting garden awnings and sunshades. The optical rainfall sensor would react too late after the rain starts, as it increases the rainfall total figure only after it has been raining for a while already.

For that rain alert function I keep my electrolytic rain detection sensor which reacts pretty immediately after a first few raindrops reach the detection plate. The electrolytic however cannot measure the amount of rain. So having these two is complementary.
The Rainfall is here interpreted as a total value since the start of the station, so for data interpretation in Loxone it makes sense to use Meter (Me) block, which is normally used for utility meters. Connect the register reading directly to meter reading input (Mr) and do not forget to divide the value by 100 to get it in millimeters. The easiest way is to use the Correction –100 ⟶ –1 and 100 ⟶ 1.
The measurements are very interesting. In September 2024, when we had the floods here in our region, the amount of rain was really significant. And such extreme reins were in line with the official measurements.

The device register can be also cleared, if necessary (for instance once a year?). Set 1 to 0x06 (06) RW register and the rainfall total will be automatically cleared.
Air Pressure
Air pressure sensors in home weather stations typically need to be adjusted for altitude. I couldn’t get any details about what data the sensor is providing. What was misleading to me was mainly that the weather station reports some altitude under 0x07 register and that value is not fixed but changes randomly. But there is no word about what it is, so I am ignoring that value, because I don’t know where this is coming from.
Certainly, let’s recalculate the sea-level pressure using the correct temperature units (Celsius) in the simplified formula.

- p0 is the relative pressure at the sea level
- p je absolute pressure from the sensor
- t is temperature in degrees Celsius
- h is height (altitude above sea level)
For Loxone usage this would be implemented the following way:
P0=P/(1.0-0.0065*h/(T0+273.15))^5.255
Using the Equation block, where I connect:
- I1 as the pressure from the sensor (P)
- I2 my altitude above sea level (fixed value from a map or GPS)
- I3 ambient temperature in degrees Celsius
=I1/(1.0-0.0065*I2/(I3+273.15))^5.255
This will result in the relative air pressure in hPa. Please note that the value the weather station is sending needs to be divided by 100 to get kPa, or dividing by 10 to get result in hPa. I am doing that at the very input level using the two point Correction field, where –1000 is –100, and 1000 is 100 to get hPa value.

The plot visually represents the linear relationship between the input and output values, where the output is simply the input divided by 10.
I compared the calculated relative air pressure with measurements from the nearest airport for several values, and my results showed close agreement. Many personal weather stations lack proper calibration, leading to significant inaccuracies. You can easily observe this by hovering over stations near you on Wundermap.
Temperature, humidity and dew point
With the exception of the unsigned/signed integer data configuration issue I addressed earlier, the Fengtu weather station has been performing well.
I initially had concerns about temperature accuracy during hot summer days, given the station’s roof-mounted position and potential exposure to direct sunlight. However, the temperature readings have been surprisingly accurate. Documentation is saying that the temperature resolution is 0.1°C, the accuracy ±0.3°C.
For example, on August 31st 2024 at noon, the station recorded 31.1°C, while a reference thermometer in the shade showed 30.6°C. Similarly, on the following morning at 6:00 AM, the station read 18.5°C compared to 17.1°C from the reference. During freezing conditions, I’ve noticed the station tends to report slightly higher temperatures. On January 14th, the station indicated -3.5°C at 3:00 PM, while the reference thermometer showed -4.7°C. This suggests a slight internal heat source within the station, potentially from stabilizing the power supply, which may be affecting low-temperature readings. I will continue to monitor the station’s performance to identify any consistent patterns or potential issues.
As for humidity, I think this works perfectly and as expected, and dew point is calculated value so there is nothing to say about this. Humidity has the resolution of 0.1%RH and accuracy should be ±3%RH.
Illumination and solar radiation
The documentation contains the following details about the measurements:
| Range | Resolution | Accuracy | |
| Illumination | 1-188000Lux | 1 Lux | 0.045Lux |
| Solar radiation | 0-1800W/m2 | 1W/m2 | <±3% |
I don’t have anything to compare my data with. That August 31 2024 day at noon it showed illumination 105 502 Lux and solar radiation 833 W/m2, then next day at 6AM 130 Lux and radiation was 1W/m2.
Overall experience
I’m very pleased with the weather station’s performance. Installation took some effort, including modifications to the wiring, surge protection, and the addition of a Modbus extension. However, the effort was worthwhile. For the past year, the station has operated reliably, providing consistently accurate readings. The only minor issue is a slight deviation in temperature readings at very low temperatures.
What could we do better?