Continuing the story about the utility meters and its connection to Loxone. Again, not talking about any Modbus meter integration here, I am about to get the data from official utility meters.

I described the integration of a gas meter in my previous post, let’s focus on electricity meter here. Before we jump into it, let’s make few things clear. Optical reading of the pulses will never be absolutely reliable. These meters do have better options how to connect (IR Meter reader, S0 pulse output), but because of the strict rules and restricted access to the meters outputs, the LED pulses are the only “non-invasive” method of capturing the measurements. And still I read some comments about placing the sensor on the acrylic cover of the electricity meter as not acceptable.
Now, reading the LED pulses from the meter is very dependent on few important factors. Sensitivity of the detection circuit is the key here and I spent quite some time optimizing and tweaking the sensor, and then there is the shielding other light sources. The best results are obviously when the meter is in complete darkness, but then the problems that can cause some inaccuracy is whenever someone opens the cabinet and daylight interferes with the sensor.
The sensor itself requires some DIY skills. There is no ideal ready-made one, or at least I was not able to find one. But no worries, Photo-transistor, NPN transistor, two resistors, and a diode will do the trick. I am sharing here the schematic diagram of the wiring I successfully tested and implemented myself.

List of components
- T1 : Photo-transistor L-NP-3C1 (IR-FotoT 940nm 30V 0.1W)
- T2 : NPN Transistor (KC 508)
- D1 : Normal diode to have some polarity protection
- D2 : Removed in order to get the maximum on the output
- R1 : Rezistor 8k4Ω
- R2 : Rezistor 5k6Ω
How it works? Photo transistor is placed in front of the red LED of the meter. Every pulse of the LED means certain amount of energy consumed. This detail is written on each of the electricity meter. If the photo transistor T1 registers any light it closes the circuit from collector to emitter and this triggers the T2 transistor to close as well. Closed T2 means almost zero voltage on the output side of the circuit as opposed to the open state where we have there the input voltage (24V) lowered by the resistor R2. The output of this circuit can be connected directly to the one of the Loxone digital inputs. The state will be high when there is complete darkness, and low whenever there is a light detected. Simple inversion if the signal will give you pulse to be consumed by the utility meter block in Loxone config.
The proper setting of R1 and R2 is a key to the success of the schematics. Both values will need to match the specs of the related transistors. For instance, lowering the resistance R2 will increase the voltage in the idle output, but at the same time increase the current that will go through the T2 when T1 is lit up.
In one of the last optimization iterations I have removed the second diode (D2) from this diagram to get the most of the output. Obviously, some further additions could have been added to shape the output signal pulses properly. However, Loxone is able to deal with these without any issues, so I avoided a Schmitt trigger to keep this simple.
Please note, that the sensitivity of the whole detection circuit is very dependent on the transistors you’ll get, so some minor tweaks might be necessary. Feel free to share your experience and thoughts below the post or in the forum.
It works! I used transparent adhesive tape to place the photo-transistor facing the red LED on the meter, and put the rest of the circuit board into a small box next to it. I just added one indication LED with resistor to indicate the circuit is working and used standard ethernet connector (RJ-45) and socket to make this detachable from the cabinet for any kind of maintenance.
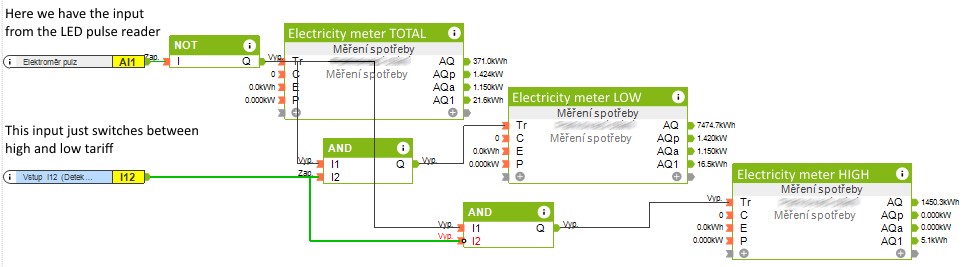
The Loxone SW setup is very simple. In my case I measure the total energy consumption, but also the consumption in both HI and LO energy plan. This is country specific, so you might not need to bother with such complexity.


And this is how it looks like in Loxone. The config is really simple there. I am using three meter blocks just to get the absolute total, and then the split of amount spent in high and low tariff.
And the final look at the installation…


What could we do better?